Article · Field note 43
One encounter answers one question
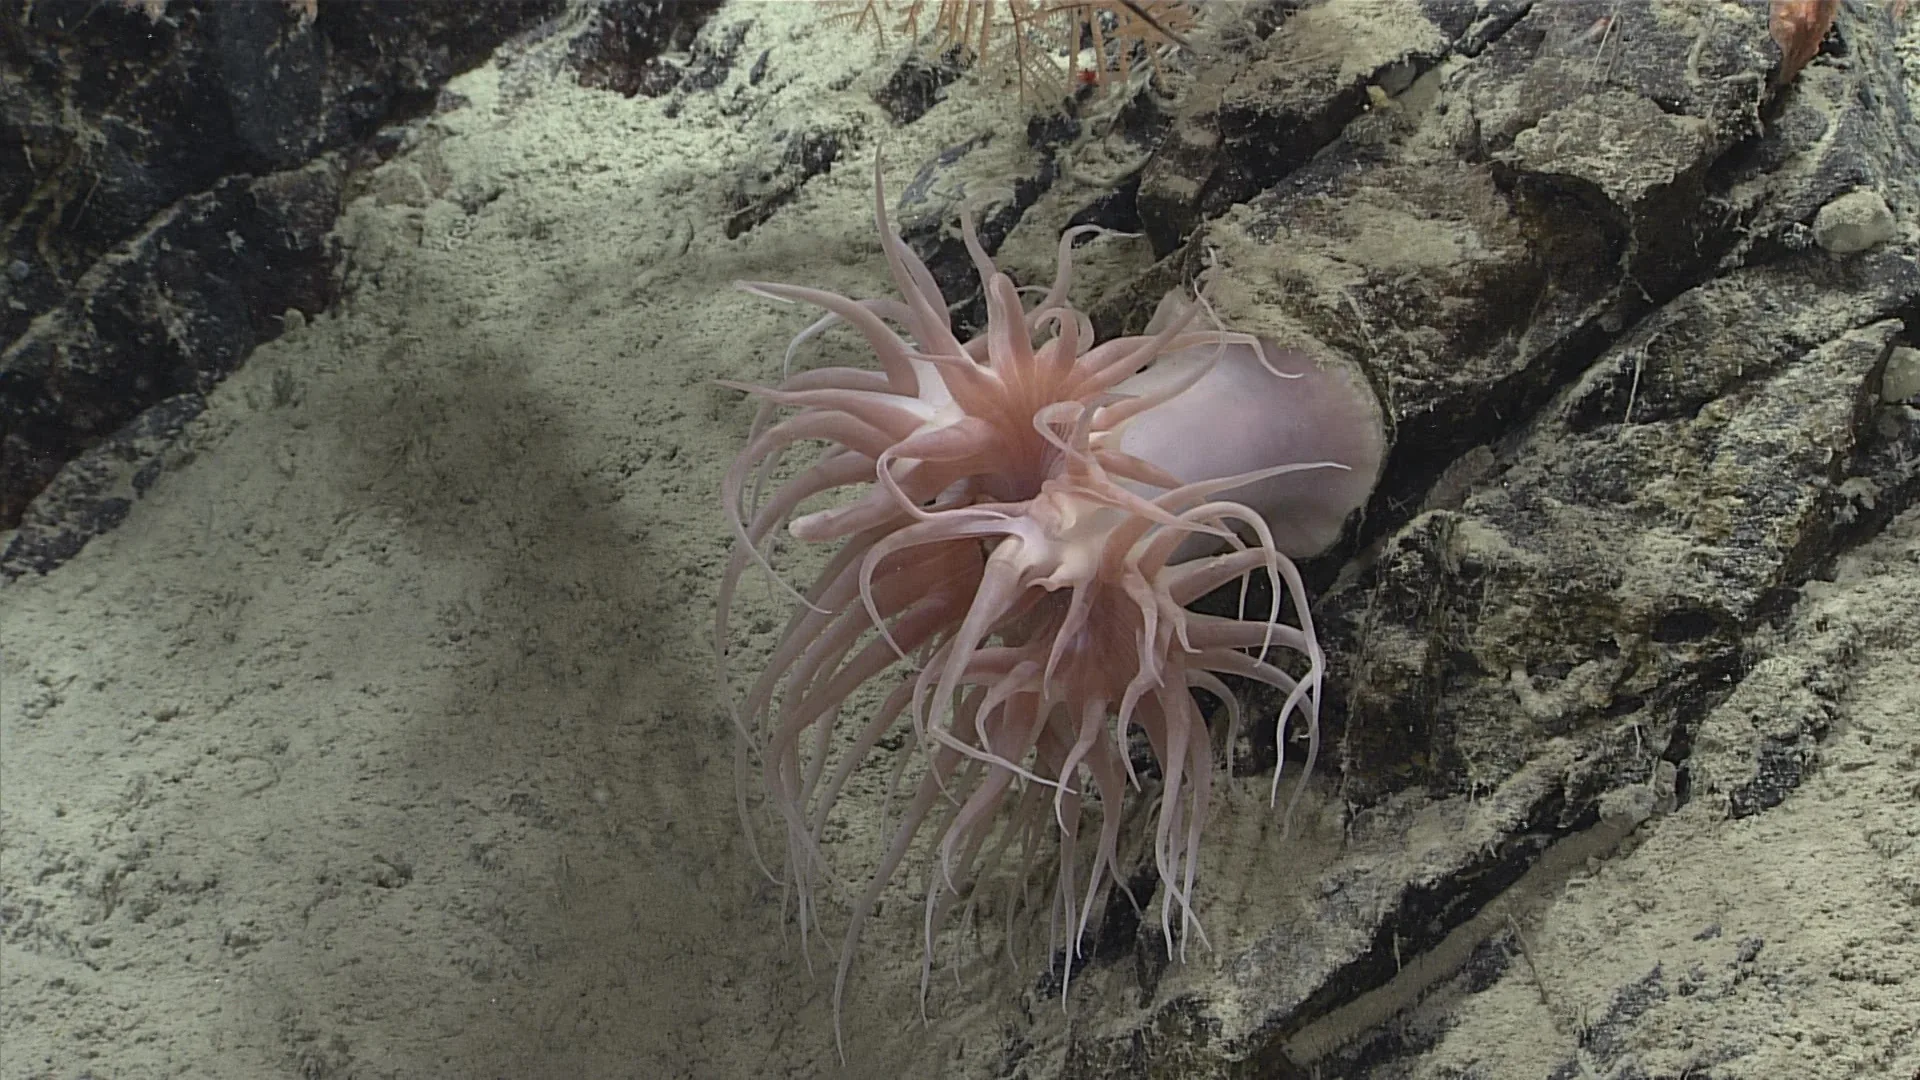
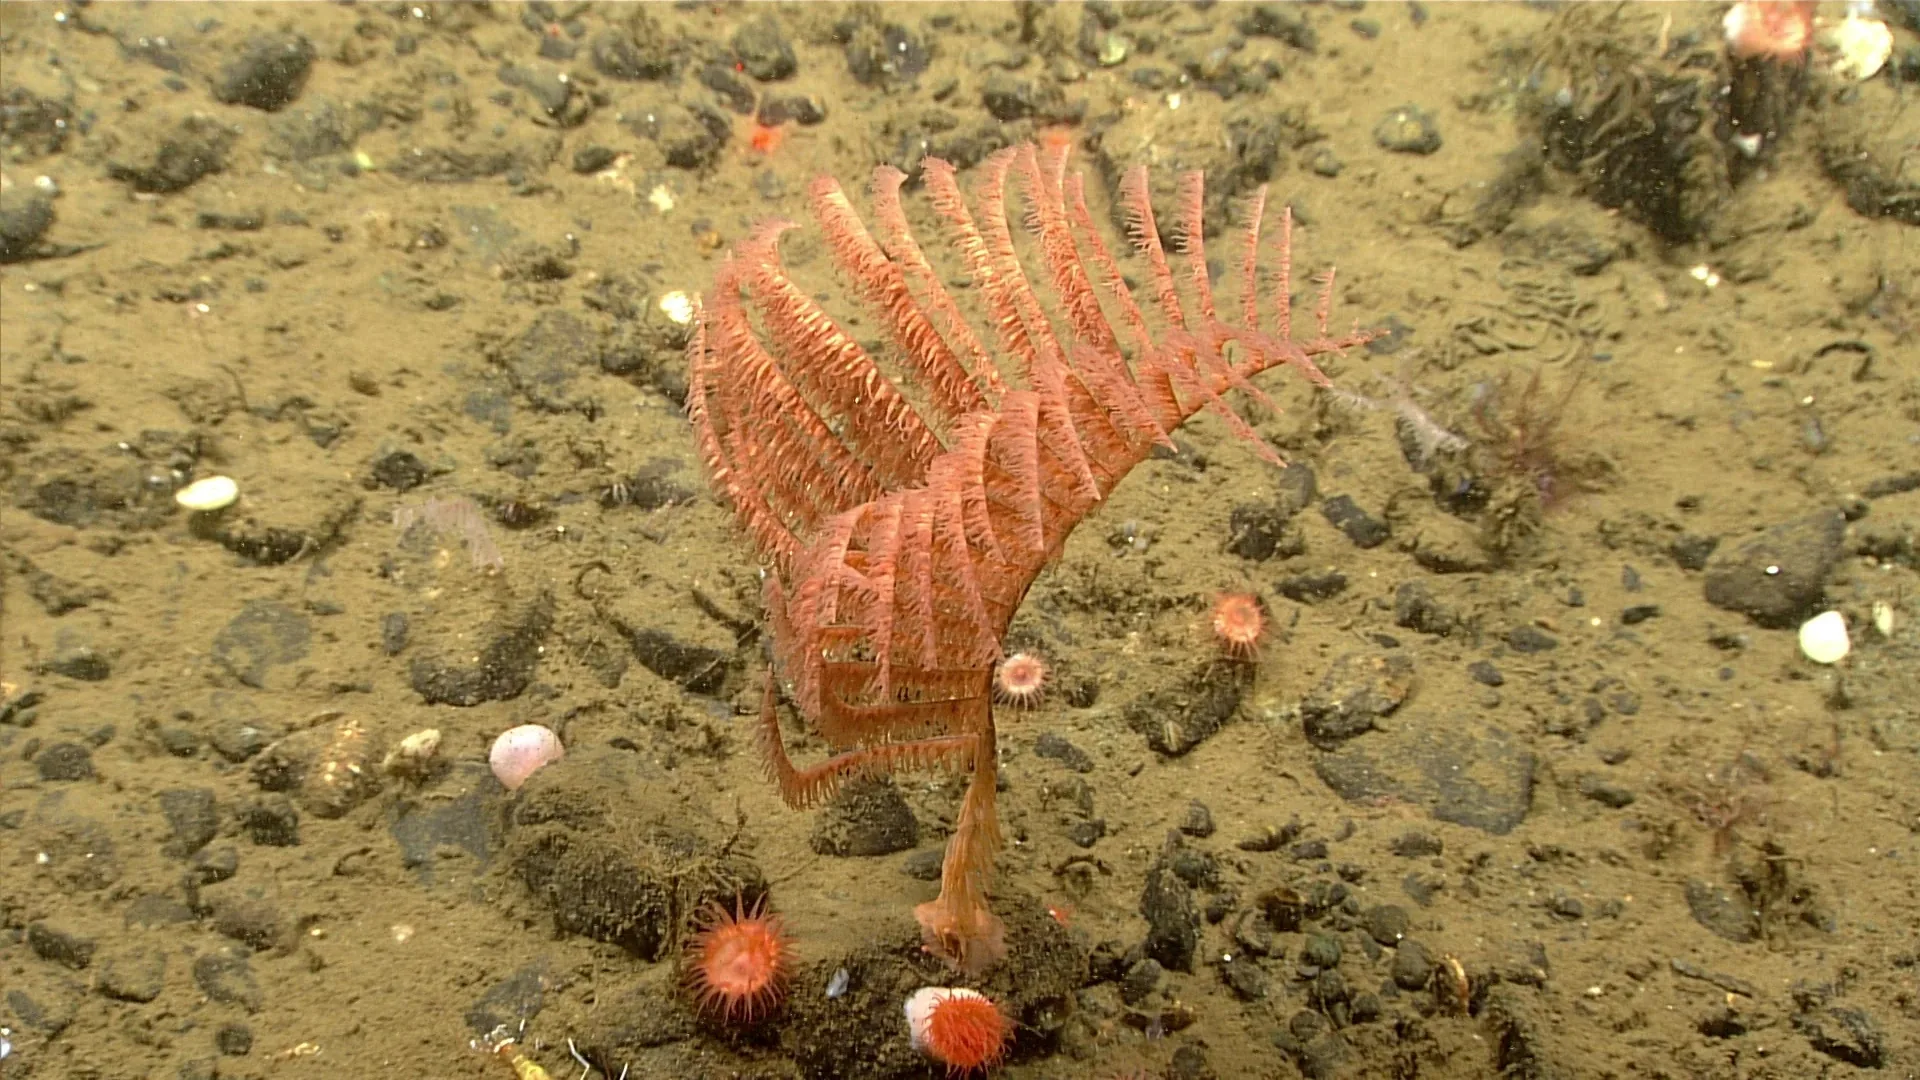
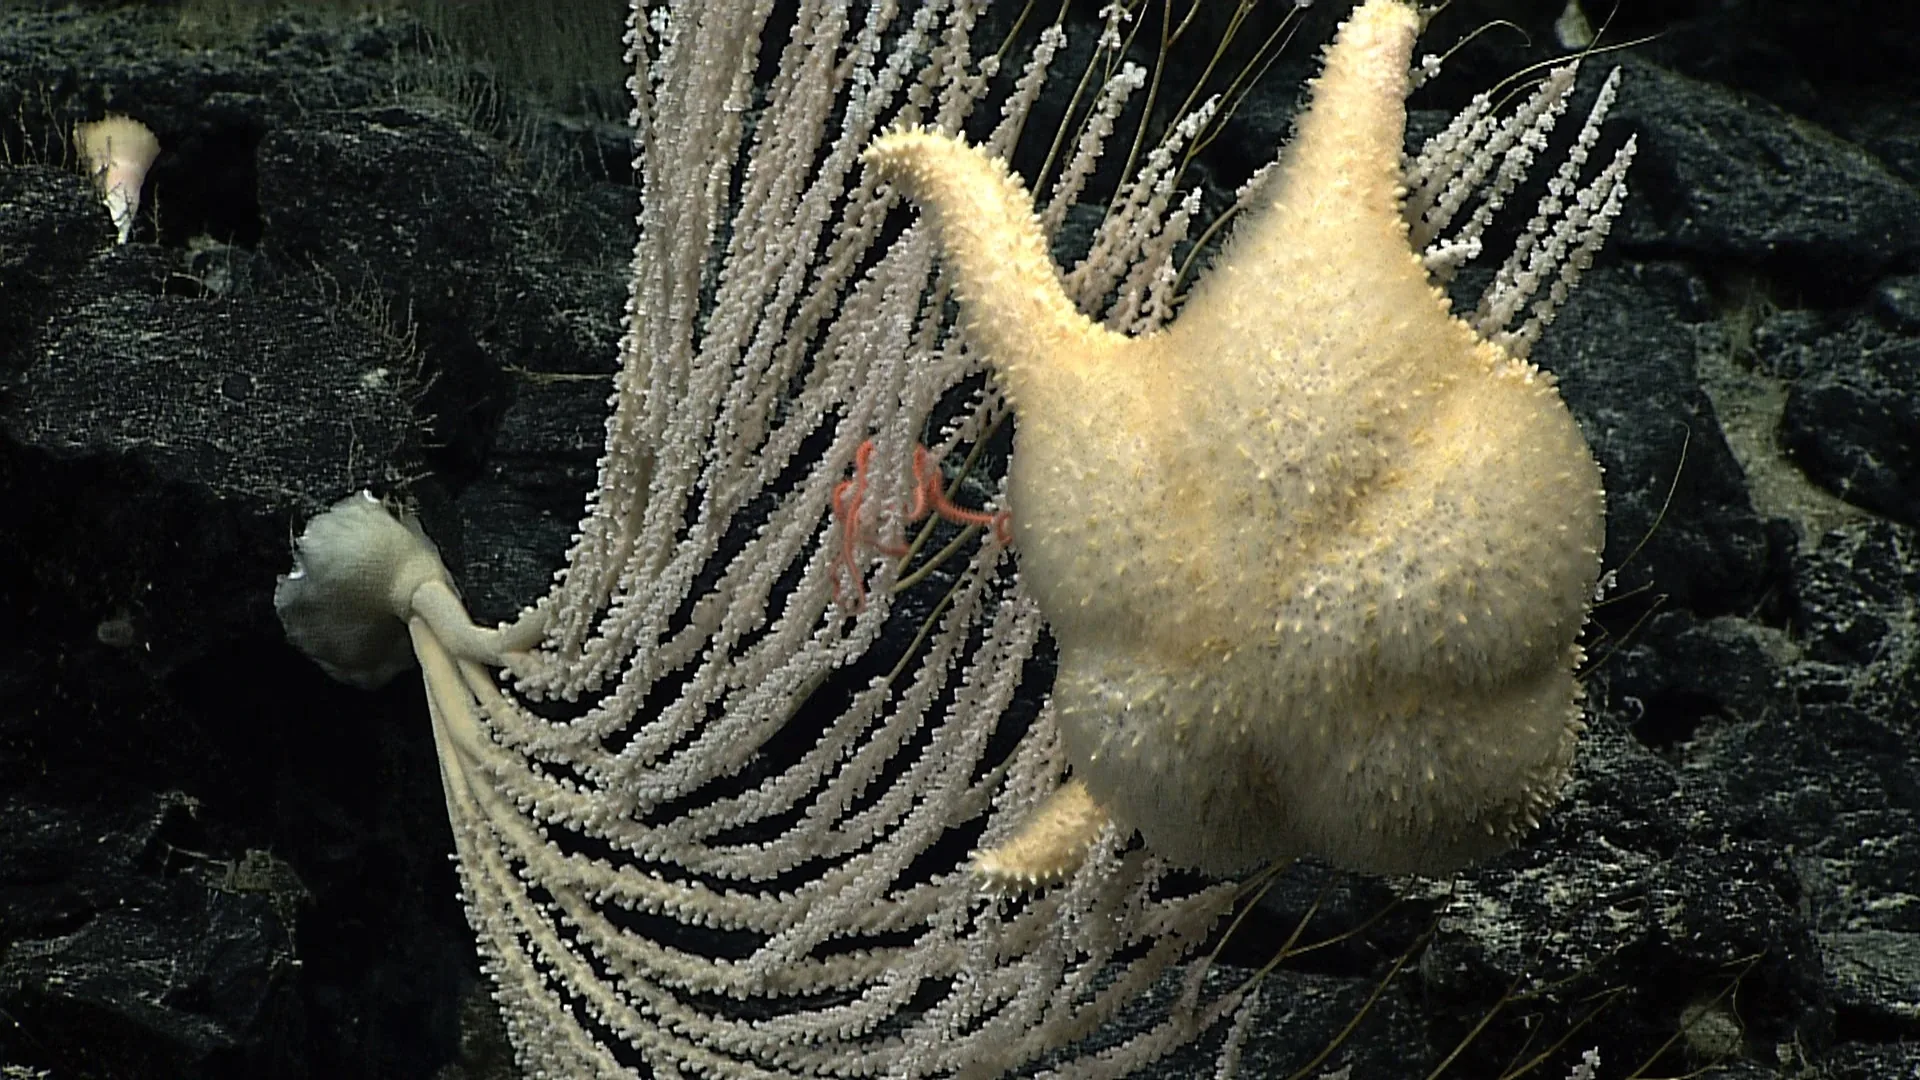
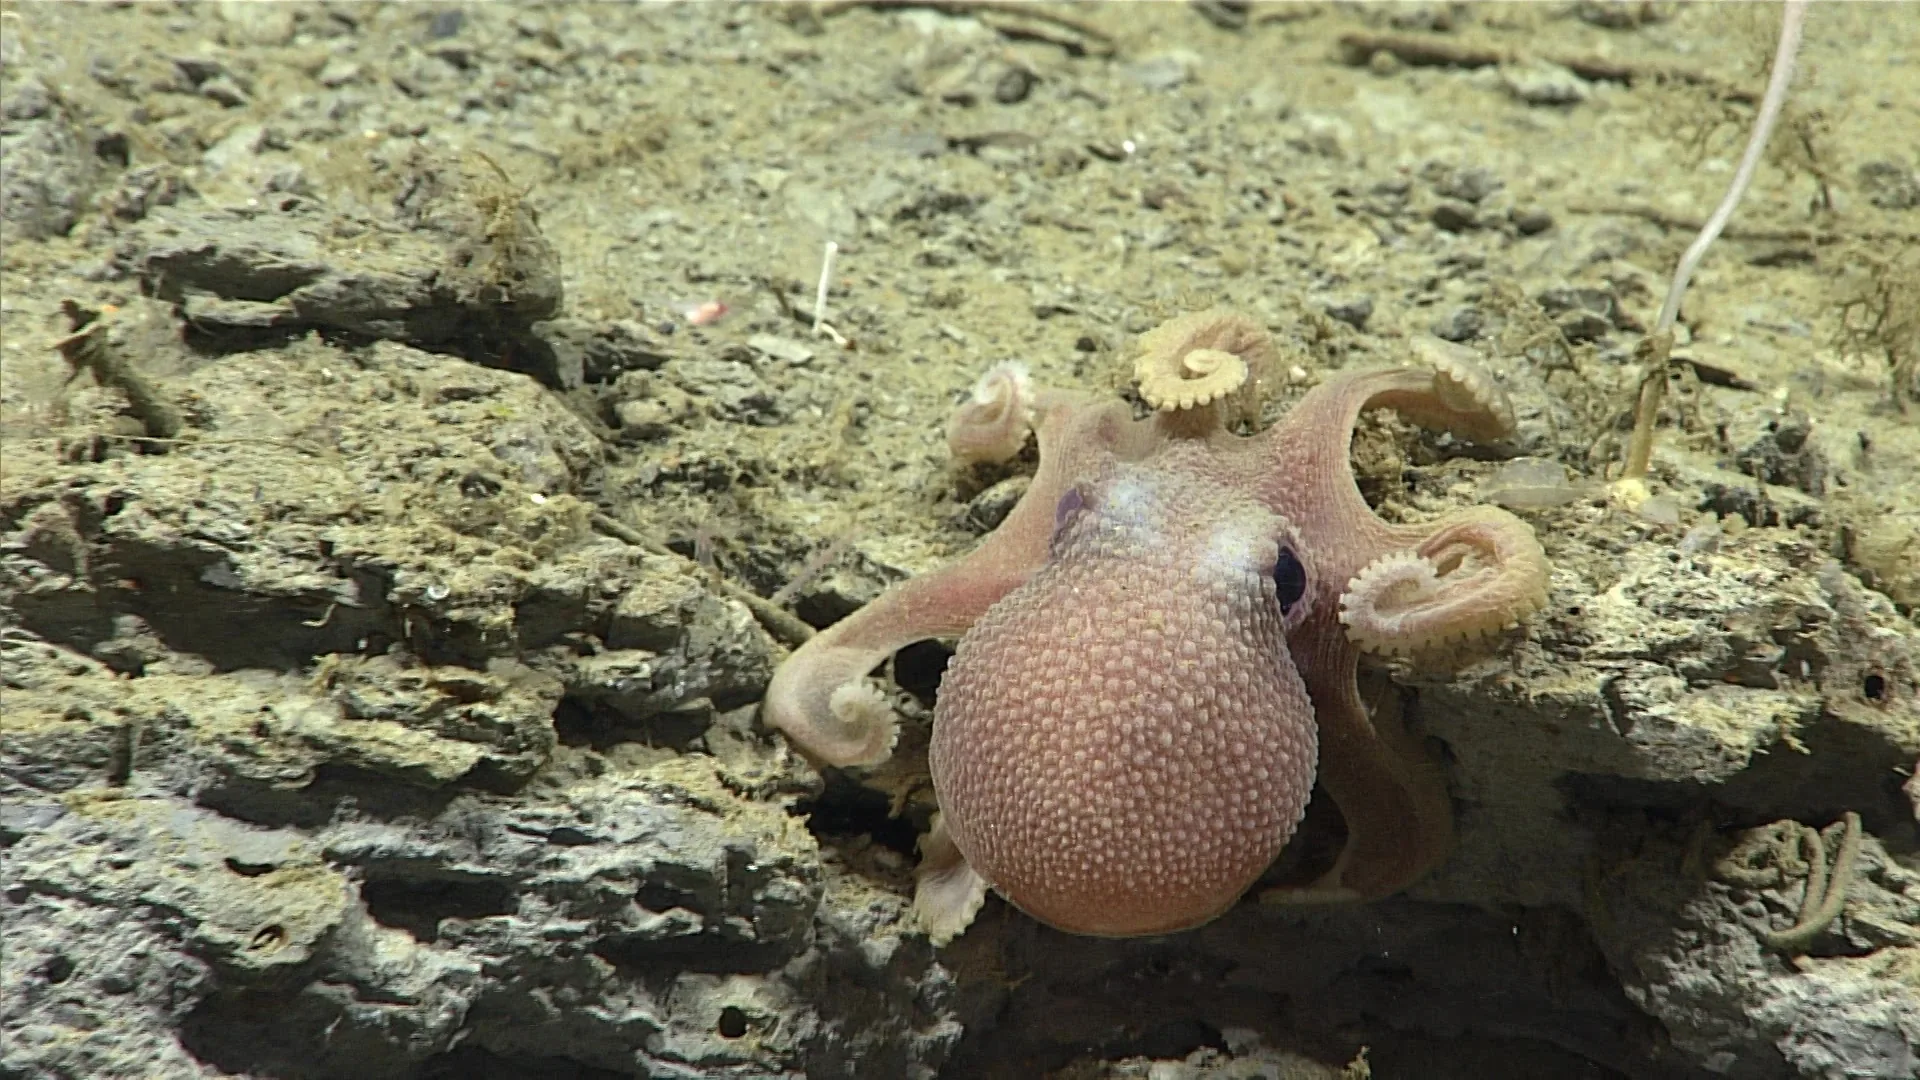
A remotely operated vehicle passes over a canyon wall and records an animal. The image can confirm that the animal was visible at that location and time, subject to the identification’s confidence. That is valuable evidence. It is not a census, a population estimate, or proof that the animal is rare. A sighting supports a bounded claim; broader claims require a sampling design.
NOAA’s animal identification guide links its observations to depth, region, locality, date, and dive. Those details make a record traceable. They also make its limits easier to see: one image came from one camera and one route, in a place the expedition selected for a reason.
Presence is easier than absence
If a species appears in a frame and the identification is sound, it was present in the camera’s view at that moment. If the species does not appear, the evidence is weaker. The animal could be buried, hidden behind a rock, outside the field of view, too small to resolve, or inactive during the dive. It might also be present at another depth or season.
This asymmetry is common in ecological surveys. A detection is evidence of presence; a non-detection may indicate absence or imperfect detection. Researchers address the problem with repeated visits and models that estimate the probability of seeing a species when it is there. The camera’s altitude, speed, light, visibility, and observers all influence that probability.
An exploratory ROV dive is usually not designed as a random census. The route may follow a geological feature or target a habitat question. It can reveal surprising animals and lead to new hypotheses, but it does not necessarily sample a known fraction of the seafloor. To estimate abundance, scientists need a survey area, consistent effort, and a method for deciding how many animals were missed.
Why a photo count is not an abundance estimate
Suppose a database contains 30 photographs of a fish and only one of a sea cucumber. It would be unsafe to conclude that the fish is more common. The species may differ in visibility, size, movement, contrast, and ease of identification. One may be more likely to occur along the expedition’s route. Images may also be selected for a guide because they show a clear view.
Abundance estimates require effort denominators: distance surveyed, area viewed, hours of observation, or number of standardized traps. A transect survey may record animals per kilometer, while a camera lander may estimate arrivals per bait deployment. These quantities answer different questions and cannot be compared without accounting for design.
Researchers sometimes use repeated imagery to estimate density or occupancy. They need to account for overlapping frames, individual animals moving in and out, and the camera’s view width. Laser scaling or vehicle navigation data can help measure area, but poor visibility and complex terrain complicate the calculation. A photo archive generally preserves observations, not a complete census.
Rare, elusive, or under-sampled?
An animal can be hard to find for several reasons. It may genuinely have low population density, use a small or unusual habitat, move through the area briefly, or resemble the background. It may be too fragile for standard nets or too small for the camera. A species known from few records may simply have been collected only rarely.
To distinguish those possibilities, scientists compare multiple methods. Baited cameras attract mobile scavengers but miss animals that do not respond to carrion. ROV transects show in-place organisms but cover a narrow swath. Trawls sample a larger volume but can damage fragile animals and avoid rough terrain. Environmental DNA can detect genetic traces but has its own limits in location and quantification. Agreement across methods strengthens the inference.
A sighting can still be important
One observation can document a new locality, show an animal in a posture not previously recorded, or guide a specimen collection. An image can preserve context that would vanish when the ROV leaves. If the record includes the dive and timestamp, researchers can examine adjacent video and environmental data.
An unusual sighting may also reveal where existing models are weak. If a species appears outside its expected range, the right response is to check the identification and provenance, compare museum records, and seek corroboration. It should not be dismissed automatically, but neither should one frame rewrite a distribution map without review.
Design a survey around the question
Before counting, researchers define what they want to know: occupancy, density, size structure, behavior, or community composition. Each requires a different unit of observation. A camera can be well suited to counting visible megafauna along a transect, while sediment cores may be better for small burrowing organisms. A baited lander can compare scavenger response, not total bottom fauna.
Sampling should also be repeated across locations and times. A single dive cannot capture seasonal change or the full variation of a canyon. Replication helps separate a site-specific event from a broader pattern. Statistical models then account for detection limits and variability, with uncertainty reported rather than concealed.
For example, reporting detections per measured transect length makes survey effort visible. It still requires comparable viewing widths and detection conditions before the values can be interpreted as differences among habitats.